
Order flow
Open interest explained: units, venues and reading it with price
What open interest counts, why coins and dollars tell different stories, how to add exchanges without fake jumps, and four ways to read it with price.
Price tells you what traders paid. Open interest tells you how many positions are still open after they paid it, which is why it is worth reading next to price on futures charts. This guide covers what the number counts, why the unit you choose changes the picture, how AlertaChart adds five exchanges together without inventing jumps, and how to read open interest together with price. The Help Center article on order flow lists every tool mentioned here.
What open interest counts
The U.S. Commodity Futures Trading Commission defines open interest as the contracts that have been entered into and not yet offset by a transaction, delivery or exercise, and notes that total long open interest always equals total short open interest. Every open contract has a buyer on one side and a seller on the other. Open interest therefore measures how much is at stake, not which side is larger: there is no market with "more longs than shorts" in contract terms.
It also differs from volume. Volume counts every trade; open interest changes only when a trade opens or closes positions:
- A new buyer meets a new seller: open interest rises by the traded size.
- A holder of a long closes against a holder of a short who also closes: open interest falls by that size.
- One side closes while the other opens: the position changes hands and open interest stays the same.
That is why a day of heavy volume can leave open interest flat, and a quiet drift can still build a large position.
Coins or dollars: the unit changes the story
Exchanges report the same thing in different units. OKX's API gives open interest in contracts, in coins and in US dollars side by side, and its BTC-USDT perpetual contract is worth 0.01 BTC; Binance's statistics carry both a coin amount and its value; Coinbase reports contracts with their contract size. Before anything is added up, AlertaChart converts every exchange to the coin itself, so 1000PEPE contracts count as PEPE.
The two units then answer different questions. Example numbers: 100,000 BTC of open interest with the price rising from 80,000 to 88,000 dollars. In coins nothing changed. In dollars, open interest grew from 8.0 billion to 8.8 billion, a 10% rise produced entirely by the price, without a single new position.
- Coin amount shows positions being opened and closed. Use it to judge whether traders are adding or leaving.
- Dollars show how much money is exposed. Use it to compare coins with each other, or to see how large the leveraged market is relative to the price.
In dollars, AlertaChart values each open-interest reading at its own time, using the exchanges' own dollar value where they publish one and otherwise the chart's price, so a candle's open matches the previous candle's close.
Adding up exchanges without fake jumps
The Agg. Open Interest panel sums Binance, Bybit, OKX, Coinbase and Hyperliquid for one coin. The difficulty is that their recorded histories start on different dates. A plain sum steps up on the day a large exchange's data begins, and that step looks exactly like a sudden wave of new positions. The panel's Start setting offers three ways to handle it:
| Start option | What you see |
|---|---|
| From the first venue, earlier history scaled (estimate) — the default | Starts with the earliest exchange. When another one joins, everything before the join is multiplied by the jump its arrival causes (total with it ÷ total without it), so there is no step. The scaled part is an estimate, and the join is still marked. |
| When every venue has data | Starts once every large exchange has data. An exchange holding less than 2% of the latest total does not move the start; it joins later with a mark. |
| From the first venue with data | The raw sum: the level steps up each time an exchange joins. |
Example numbers: four exchanges hold 200,000 BTC together when a fifth with 20,000 BTC joins. The raw sum jumps 10% in one candle. With the default option, all earlier history is multiplied by 220,000 ÷ 200,000 = 1.1 instead, so the line is continuous and the change in open interest before the join keeps its shape.
Gaps get similar care. Missing data never counts as zero. An exchange that skips readings keeps its last level across a gap of up to a day instead of dropping out and coming back as a dip, while an exchange that stops reporting leaves the sum after a short hold of at least an hour. Each candle opens at the previous close; its high and low are the highest and lowest total seen inside it, checked every 5 minutes, or every hour on 1-hour and longer charts.
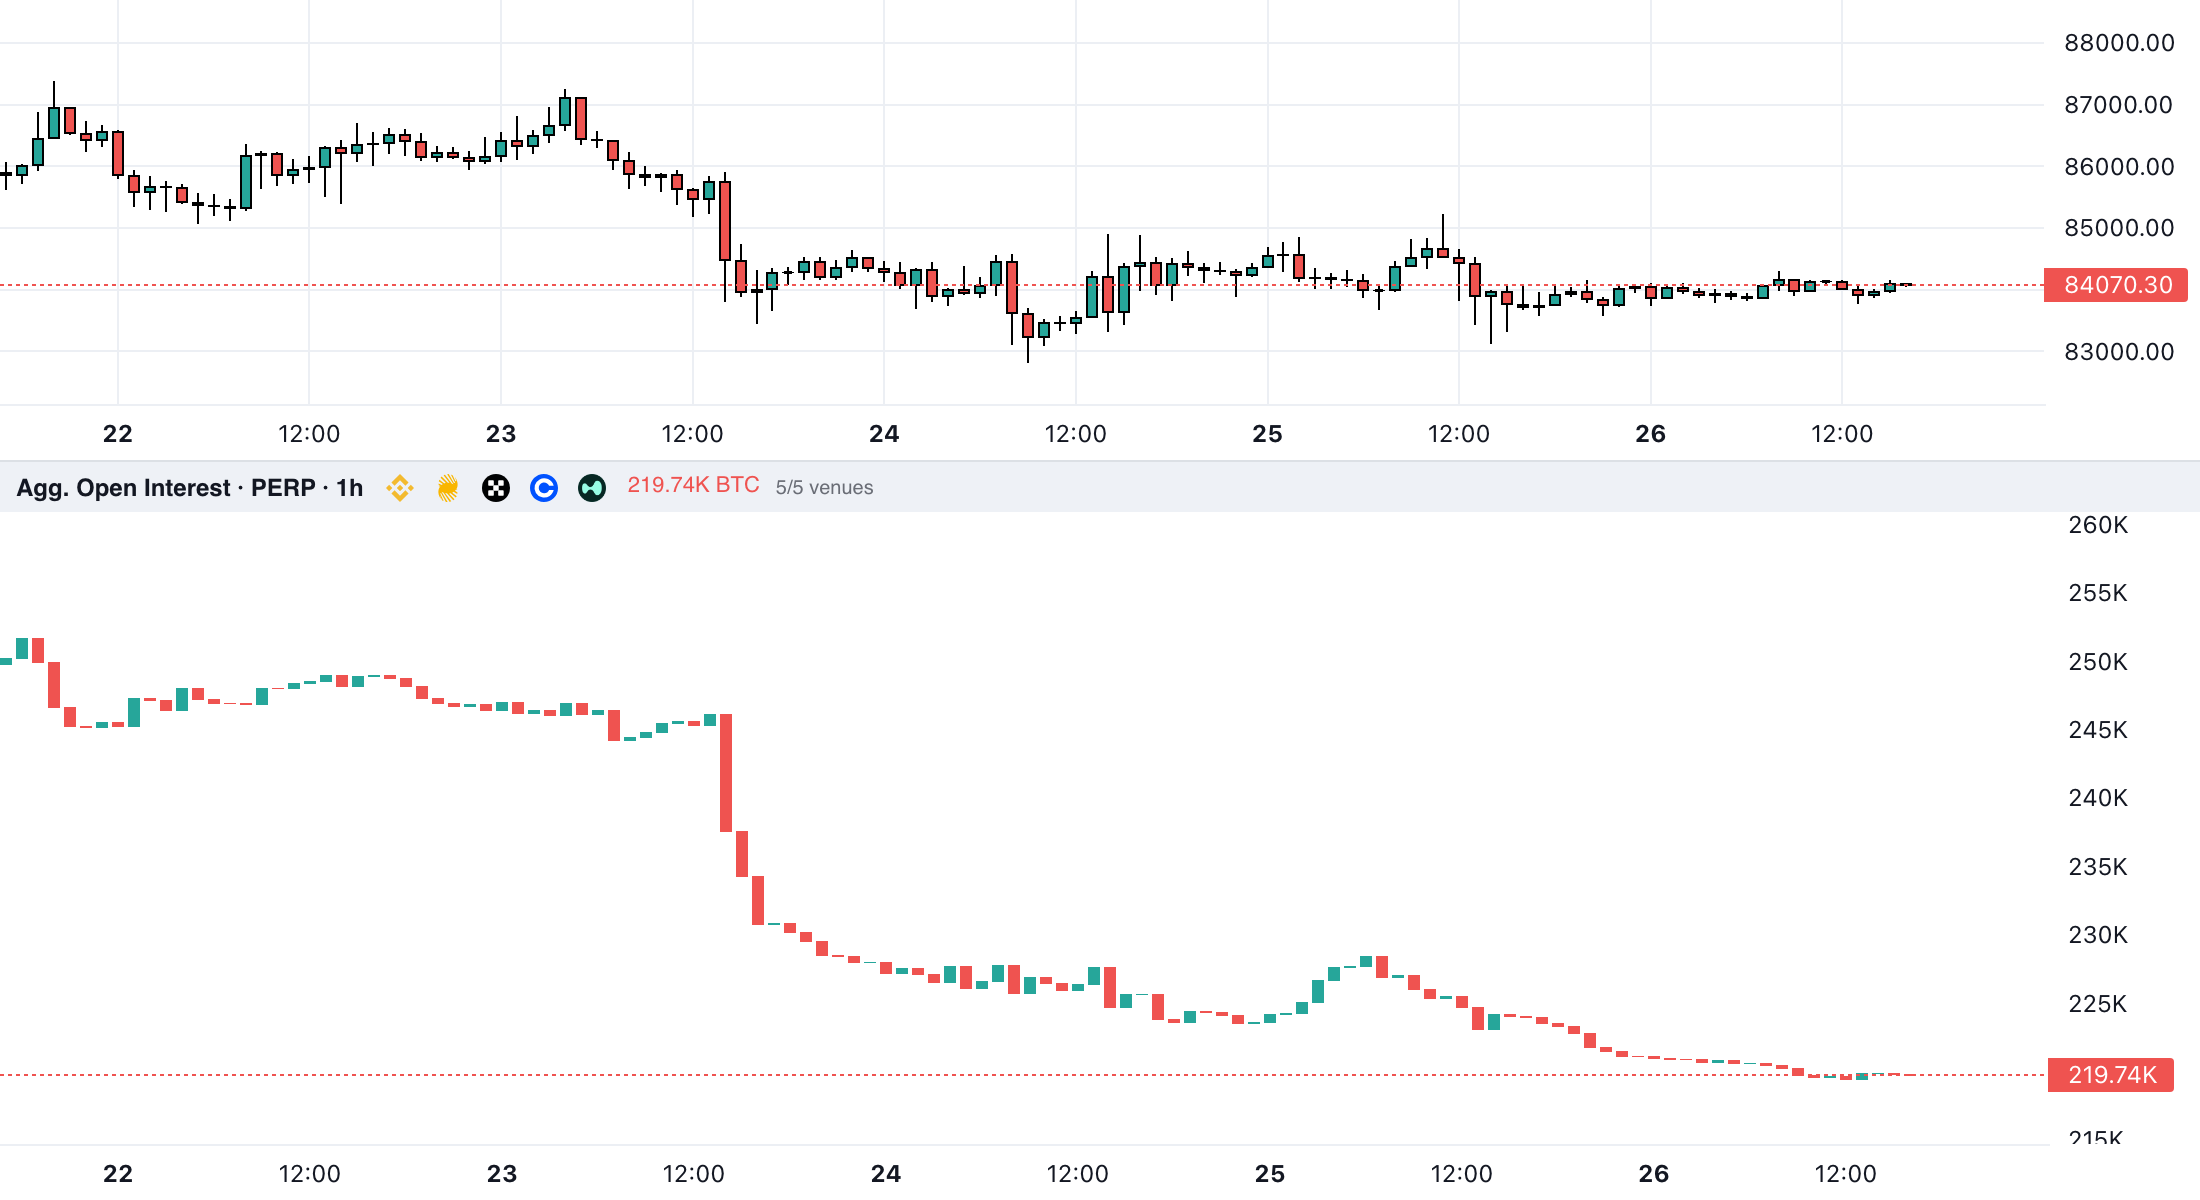
Reading open interest with price: four combinations
Open interest becomes useful when you read it against the price move over the same candles. The usual readings are below. Treat them as starting points, not rules: open interest cannot tell you which side started the trades.
| Price | Open interest | What happened to positions | Usual reading |
|---|---|---|---|
| Up | Up | New positions were opened during the rise | New money is behind the move |
| Up | Down | Positions were closed during the rise | Often shorts buying back; the push can fade once they are done |
| Down | Up | New positions were opened during the fall | Often new shorts pressing; they can be squeezed if the price turns |
| Down | Down | Positions were closed during the fall | Longs leaving or being liquidated; leverage is being cleared out |
To tell those cases apart, add the tools that do know direction. CVD shows whether market buyers or sellers were the aggressors. Funding shows which side pays to stay in (see the funding rate guide). Liquidation data shows which part of a fall in open interest was forced (see the liquidation heatmap guide). The Help Center's own rule of thumb is the healthy case: price, CVD and open interest rising together.
Open interest in AlertaChart, step by step
- Open a crypto chart. For one exchange you need a perpetual chart (symbols ending in .P); the aggregated panel also works on spot charts and reads open interest from the coin's perpetual markets.
- Click Orderflow in the chart toolbar to open the Orderflow Toolbox.
- Add Open Interest for the chart's own exchange. Once it is on, the Units switch under it chooses Coin amount or US dollars (USD); the same switch is in the gear on its panel.
- For the whole market, add Agg. Open Interest under Aggregated (all venues). Hover over an exchange logo to see its pair, the date its data starts and its value under the crosshair.
- Open the gear on the panel for the settings below.
Open the BTC/USDT perpetual chart, then add Agg. Open Interest from Orderflow →Pro
The order-flow tools are part of the Pro and Elite plans (compare plans). In your own scripts, request.security reads the same series, for example AGG:BTC.P_OI for all exchanges in coins; the AlertaScript page on order flow data lists the tickers.
Settings that matter
- Units: Coin amount (the default) or US dollars (USD).
- Start: the three options in the table above; the scaled history is the default.
- Venues: switch exchanges off from their logos or in the gear. The header shows how many are counted, for example 4/5 venues.
- Mark where a venue joins: on by default. Keep it on, so you can see which part of the history is scaled or stepped.
Common mistakes
- Reading a rise in dollar open interest as new positions when the price simply went up.
- Taking the step on the day an exchange joins for a flood of new money (use the default Start, or check the join marks).
- Assuming rising open interest means more longs than shorts. Every contract has both.
- Reading one exchange's open interest as the whole market.
- Drawing conclusions from open interest alone, without price direction, CVD or funding.
Method and limitations
The definitions follow the CFTC's notes and the exchanges' API documentation; the AlertaChart behaviour follows the product code as of 5 October 2026. Know these limits:
- Scaled history is an estimate. Before an exchange joined, its share is inferred from the jump at the join, not observed.
- Uneven update rates. Coinbase publishes the open interest of its perpetuals once a day, so its part of the sum moves in daily steps.
- Limited history. The panel loads up to 30 days of 5-minute readings, or up to 400 days of hourly readings on 1-hour and longer charts, as far as each exchange's recorded history reaches.
- Five exchanges only. Positions elsewhere are not counted.
- No direction. Open interest says how much is open, never who is right.
Related guides
Sources
- Order flow: CVD, open interest, funding and liquidations — AlertaChart Help Center (accessed Oct 5, 2026)
- Commitments of Traders: Explanatory Notes (Open Interest) — U.S. Commodity Futures Trading Commission (accessed Oct 5, 2026)
- USDⓈ-M Futures API: Open Interest Statistics (sumOpenInterest, sumOpenInterestValue) — Binance (accessed Oct 5, 2026)
- OKX API v5: Get open interest (oi in contracts, oiCcy in coin, oiUsd) — OKX (accessed Oct 5, 2026)
- Advanced Trade API: Get Public Product (contract_size, open_interest) — Coinbase (accessed Oct 5, 2026)
- Order flow data — AlertaScript docs (accessed Oct 5, 2026)
This guide is for education only and is not investment advice.
How this guide was made Drafted with AI from AlertaChart's Help Center and source code; product facts checked against the code and the Help Center; external facts from the cited primary sources.
Changes · Version 1.0
- · 1.0 — First version.